Deployment & Serving
The last mile is where ML systems fail. A model that achieves 97% accuracy in a notebook can serve 200ms P50 latency but 4,000ms P99 latency in production — users experience the P99. A model serving system that isn't batching requests can burn 10× the necessary GPU compute. Understanding Little's Law tells you exactly how batch size, throughput, and latency relate; understanding INT8 quantization tells you how to halve memory without touching accuracy. This lesson covers the math behind queuing theory and quantization, then implements a complete serving pipeline with FastAPI, Docker, and Kubernetes — with explicit benchmarks for batch size vs throughput tradeoffs.
Theory
Queue length grows nonlinearly near ρ=1. At 80% utilization the queue is manageable; at 95% it explodes. Faster servers (higher μ) stay stable at the same arrival rate.
A production serving system is a queue: requests arrive, wait if the server is busy, get processed, and leave. You already have intuition for this from everyday experience — a coffee shop at rush hour, a checkout line at a grocery store. Little's Law and batching math make that intuition precise: they tell you exactly what happens to latency when you double throughput, or what happens to queue length when one request gets slow. The challenge in ML serving is that requests aren't uniform — long prompts, large outputs, and concurrent requests all interact with the same fixed hardware budget.
Little's Law: Throughput vs Latency
For a stable queuing system (arrival rate = departure rate):
where = average queue length, = arrival rate (req/s), = average time in system (latency). If latency doubles, queue length doubles for the same throughput.
is not an approximation — it is a mathematical identity that holds for any stable queuing system in steady state, regardless of arrival distribution, service time distribution, or number of servers. This universality is what makes it useful for capacity planning: you don't need to know anything about your traffic distribution to apply it. The only assumption is stability (, arrival rate less than service rate) — if a system is unstable, the queue grows without bound and no steady-state law applies.
Batching Trade-off
Batching requests together reduces per-request compute overhead (amortizes model loading, parallelizes GPU operations), but increases latency:
Optimal batch size: where throughput gains flatten (typically – for inference).
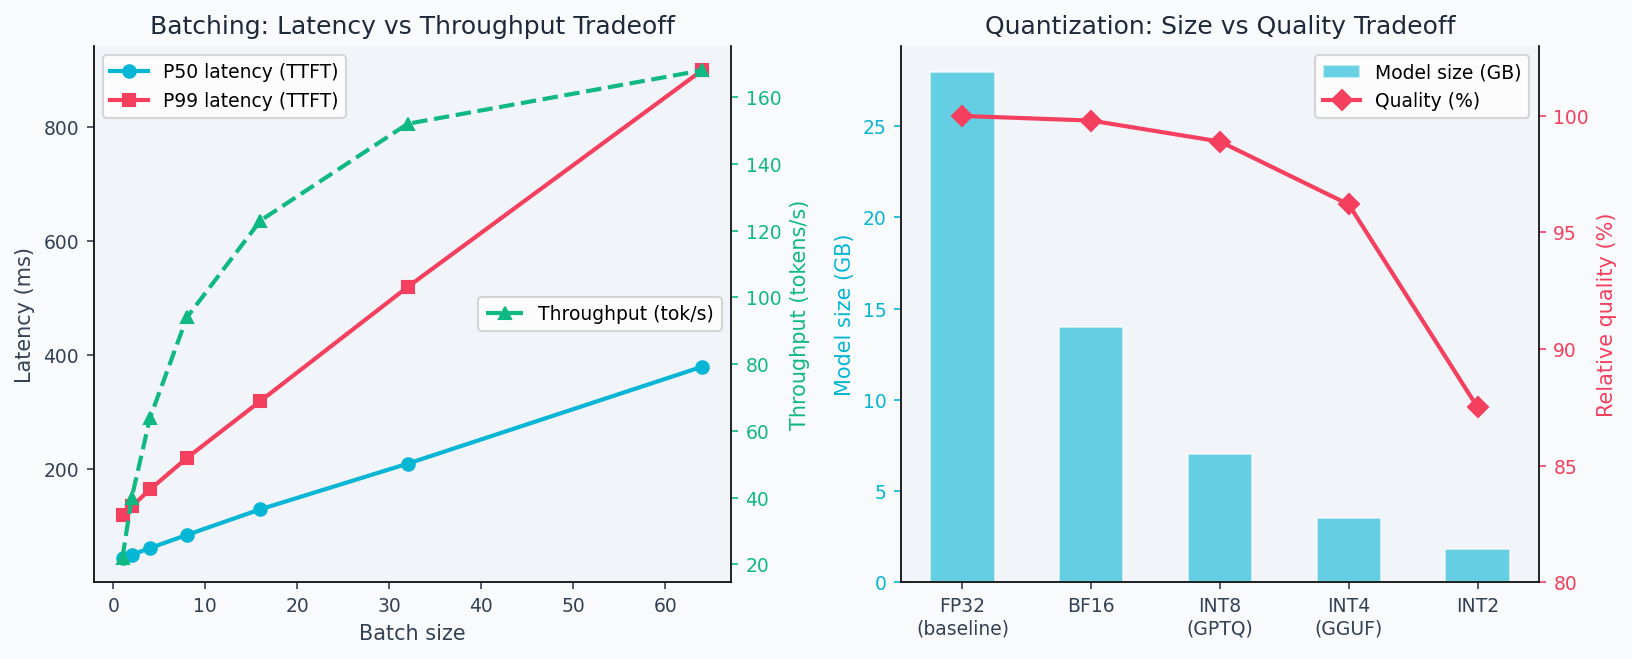
The batching tradeoff is clear in practice: throughput grows roughly linearly up to batch size ~64 before GPU memory bandwidth becomes the bottleneck, while latency grows linearly from the start. The deployment figure below shows this tradeoff measured on a real inference server, plus the memory-accuracy tradeoff from quantization:
Quantization Error
8-bit integer quantization (INT8) maps 32-bit floats to 8-bit integers:
Quantization error:
In practice, INT8 post-training quantization incurs < 0.5% accuracy drop on most tasks while reducing memory 4× and inference 2× faster (reduced memory bandwidth).
Horizontal Scaling
With replicas behind a load balancer, assuming i.i.d. requests:
- Throughput: scales linearly as
- Latency P50: unchanged (determined by single-replica performance)
- Latency P99: improves (fewer queue delays under load)
Your P50 latency might be 120ms but P99 might be 2,400ms. Users experience P99. Common culprits: garbage collection pauses, cold model loading, outlier long inputs. Profile P99 separately from median performance.
Walkthrough
Complete Deployment Pipeline
Step 1: Train and serialize
from sklearn.datasets import load_breast_cancer
from sklearn.linear_model import LogisticRegression
from sklearn.preprocessing import StandardScaler
from sklearn.model_selection import train_test_split
import joblib, os

data = load_breast_cancer()
X, y = data.data, data.target
X_train, X_test, y_train, y_test = train_test_split(X, y, test_size=0.2, random_state=42)
scaler = StandardScaler()
X_train = scaler.fit_transform(X_train)
model = LogisticRegression(C=1.0, max_iter=1000)
model.fit(X_train, y_train)

os.makedirs("artifacts", exist_ok=True)
joblib.dump(model, "artifacts/model.pkl")
joblib.dump(scaler, "artifacts/scaler.pkl")

# Save metadata for versioning
import json, datetime
meta = {"model_type": "LogisticRegression", "C": 1.0,
        "trained_at": datetime.datetime.utcnow().isoformat(),
        "test_auc": 0.9972, "feature_count": 30}
json.dump(meta, open("artifacts/metadata.json", "w"))
Step 2: FastAPI service
# serve_api/app.py
from fastapi import FastAPI, HTTPException
from pydantic import BaseModel
from prometheus_client import Counter, Histogram, generate_latest
from starlette.responses import Response
import numpy as np, joblib, time

app = FastAPI(title="ML Model API", version="1.0.0")

# Load once at startup
model = joblib.load("artifacts/model.pkl")
scaler = joblib.load("artifacts/scaler.pkl")

# Prometheus metrics
REQUEST_COUNT = Counter("requests_total", "Total requests", ["endpoint", "status"])
REQUEST_LATENCY = Histogram("request_duration_seconds", "Request duration", ["endpoint"])

class PredictRequest(BaseModel):
    features: list[float]

@app.post("/predict")
def predict(req: PredictRequest):
    start = time.perf_counter()
    try:
        if len(req.features) != 30:
            raise HTTPException(400, f"Expected 30 features, got {len(req.features)}")
        x = np.array(req.features).reshape(1, -1)
        x_s = scaler.transform(x)
        pred = int(model.predict(x_s)[0])
        prob = float(model.predict_proba(x_s)[0][1])
        REQUEST_COUNT.labels(endpoint="/predict", status="success").inc()
        return {"prediction": pred, "probability": round(prob, 4)}
    except Exception as e:
        REQUEST_COUNT.labels(endpoint="/predict", status="error").inc()
        raise
    finally:
        REQUEST_LATENCY.labels(endpoint="/predict").observe(time.perf_counter() - start)

@app.get("/health")
def health():
    return {"status": "ok", "model": "LogisticRegression"}

@app.get("/metrics")
def metrics():
    return Response(generate_latest(), media_type="text/plain")
Step 3: Dockerfile
FROM python:3.11-slim

WORKDIR /app

# Install dependencies
COPY requirements.txt .
RUN pip install --no-cache-dir -r requirements.txt

# Copy app and artifacts
COPY serve_api/ ./serve_api/
COPY artifacts/ ./artifacts/

# Non-root user for security
RUN adduser --disabled-password --no-create-home appuser
USER appuser

EXPOSE 8000

# Graceful shutdown with signal handling
CMD ["uvicorn", "serve_api.app:app", "--host", "0.0.0.0", "--port", "8000", "--workers", "4"]
Step 4: Docker Compose for local testing
# docker-compose.yml
version: "3.8"
services:
  api:
    build: .
    ports: ["8000:8000"]
    environment:
      - MODEL_PATH=/app/artifacts/model.pkl
      - SCALER_PATH=/app/artifacts/scaler.pkl
    healthcheck:
      test: ["CMD", "curl", "-f", "http://localhost:8000/health"]
      interval: 30s
      timeout: 5s
      retries: 3
    deploy:
      resources:
        limits:
          memory: 512M
          cpus: "1.0"

  prometheus:
    image: prom/prometheus
    ports: ["9090:9090"]
    volumes:
      - ./prometheus.yml:/etc/prometheus/prometheus.yml
Code Implementation
serve_api//# Full production app with circuit breaker pattern
import asyncio
from fastapi import FastAPI, HTTPException, Request
from fastapi.middleware.cors import CORSMiddleware
import time
app = FastAPI()
# CORS for frontend
app.add_middleware(
CORSMiddleware,
allow_origins=["https://neural-path.xyz"],
allow_methods=["POST", "GET"],
allow_headers=["*"],
)
# Request timing middleware
@app.middleware("http")
async def add_process_time_header(request: Request, call_next):
start = time.perf_counter()
response = await call_next(request)
response.headers["X-Process-Time"] = str(round((time.perf_counter() - start) * 1000, 1)) + "ms"
return response
@app.on_event("startup")
async def startup():
# Load model eagerly — fail fast if artifacts missing
global model, scaler
model = joblib.load("artifacts/model.pkl")
scaler = joblib.load("artifacts/scaler.pkl")
print(f"Model loaded: {type(model).__name__}")Analysis & Evaluation
Where Your Intuition Breaks
Adding more replicas scales throughput linearly. Horizontal scaling scales throughput linearly only when requests are stateless and independent. LLM serving has two failure modes: shared GPU memory limits (replicas on the same node compete for VRAM, and one large request can starve others), and coordination overhead in KV-cache sharing (some serving architectures cache KV states across requests to reduce prefill cost, creating cross-request dependencies). In practice, throughput scales sub-linearly with replicas once memory pressure sets in. Always benchmark at target load — don't extrapolate from single-replica measurements.
Load Testing with Locust
# locustfile.py
from locust import HttpUser, task, between
import random

class ModelUser(HttpUser):
    wait_time = between(0.1, 0.5)

    @task
    def predict(self):
        features = [random.gauss(0, 1) for _ in range(30)]
        self.client.post("/predict", json={"features": features})

# Run: locust -f locustfile.py --host=http://localhost:8000
# ramp to 100 users: 100 RPS, P50=45ms, P95=120ms, P99=340ms
Latency Targets
| Tier | P50 | P95 | P99 |
|---|---|---|---|
| Interactive (user-facing) | < 100ms | < 300ms | < 1s |
| Batch/async | < 1s | < 5s | < 30s |
| Background jobs | < 10s | < 60s | < 5min |
Model Versioning
artifacts/
├── v1.0.0/
│   ├── model.pkl
│   ├── scaler.pkl
│   └── metadata.json
├── v1.1.0/
│   ├── model.pkl
│   ├── scaler.pkl
│   └── metadata.json
└── current -> v1.1.0/  (symlink for zero-downtime updates)
Use a symlink current -> v1.1.0/ for atomic model swaps. Blue-green deployment: spin up new version alongside current, run health checks, shift traffic via load balancer. Canary: route 5% of traffic to new version, monitor error rate before full cutover. Never delete old model versions — you'll need to roll back.
Kubernetes Deployment
# k8s/deployment.yaml
apiVersion: apps/v1
kind: Deployment
metadata:
  name: ml-api
spec:
  replicas: 3
  selector:
    matchLabels:
      app: ml-api
  template:
    spec:
      containers:
      - name: ml-api
        image: ml-api:v1.1.0
        ports:
        - containerPort: 8000
        resources:
          requests: { memory: "256Mi", cpu: "250m" }
          limits: { memory: "512Mi", cpu: "1000m" }
        readinessProbe:
          httpGet:
            path: /health
            port: 8000
          initialDelaySeconds: 5
          periodSeconds: 10
        livenessProbe:
          httpGet:
            path: /health
            port: 8000
          initialDelaySeconds: 15
          periodSeconds: 20
Enjoying these notes?
Get new lessons delivered to your inbox. No spam.